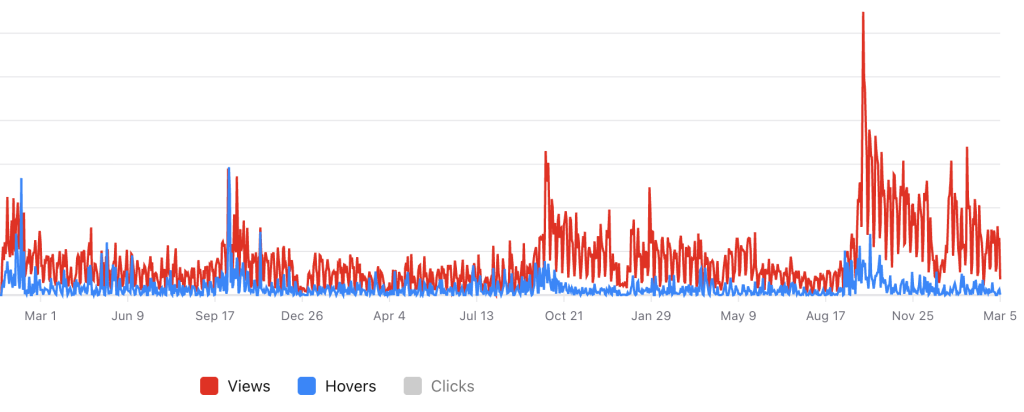
I have created over 30 ThingLink infographics as part of my role as a Digital Resources Developer at the University of Southampton and also transitioned several legacy H5P projects to ThingLink. Between January 2023 and March 2026 my infographics received over 90946 views.
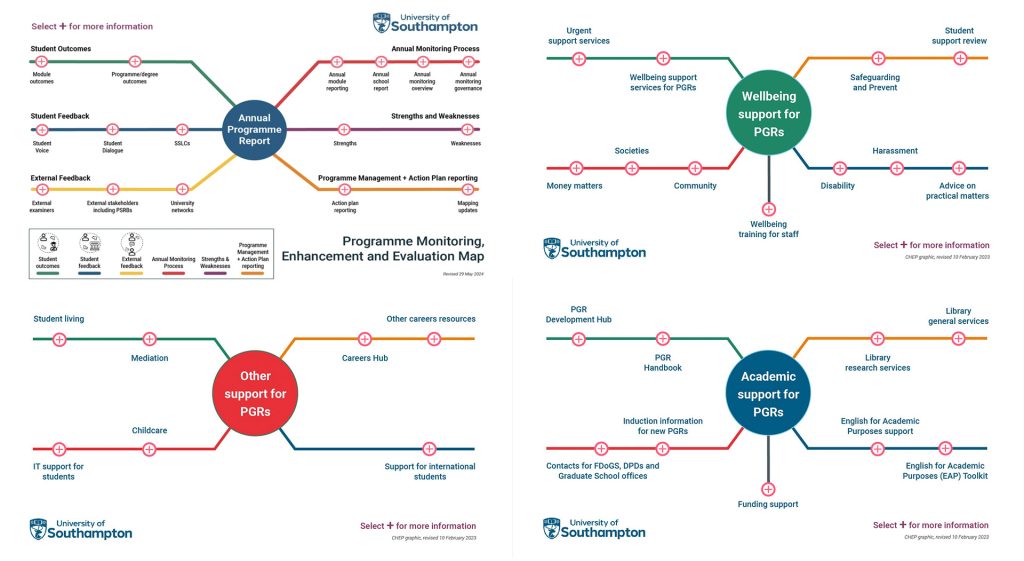
‘Tube Maps’
Some of our first designs inspired by the London Underground ‘Tube Map’ led to many requests from across our University for similar approaches to organise information. Backgrounds drawn in Adobe Illustrator before ThingLink’s integration with Canva.
Click here to view the accessible version of this interactive content
Click here to view the accessible version of this interactive content
PhD Supervisor Guide
This condenses a lot of overlapping information into something akin to a streamed timeline. It could be further simplified by moving the right hand panel to a separate ThingLink or by having three separate infographics for the three categories of user. The first where I experimented with extending the strong University brand colours with tints to improve the contrast for smaller type to meet Web Content Accessibility Guidelines (WCAG).
Click here to view the accessible version of this interactive content
Enhancing Communication and Participation
My new tinted pastel palette complemented these simpler designs, using blending modes to additively mix light towards the centre:
Click here to view the accessible version of this interactive content
‘Adults learn best when the topic is of immediate value’
A well-designed ThingLink infographic can help the learner find what they need to know when they want to know it. A tenet of androgogy, the way adults learn. (Knowles, M. S. (1975) Self-Directed Learning: A Guide for Learners and Teachers. New York: Cambridge Book Co.).
The free colour and contrast tool shown in the screen recording is Pika for Mac.
Conference Exhibitor Floor Plan
ThingLink enriched pop-ups provide summaries for each exhibitor and a link for further information:
Click here to view the accessible version of this interactive content
University Christmas Advent Calendar
This interactive holiday calendar featured on the ThingLink blog where it was kindly described as ‘Exceptionally Creative Learning Designs and Powerful Practice from University of Southampton‘
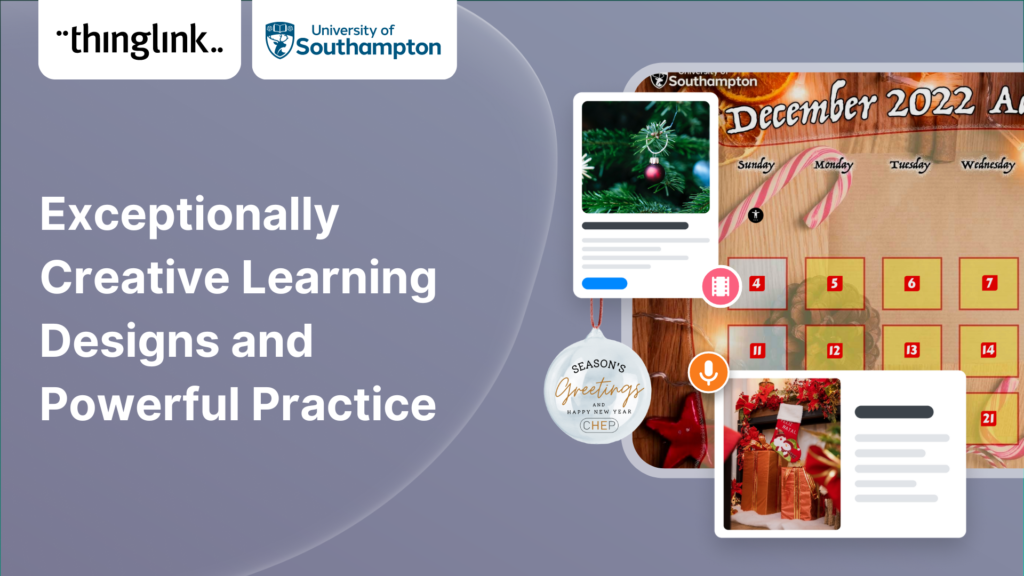
Content and support was provided collegially from both Digital Learning and the Centre for Higher Education (CHEP) in a team building exercise, at a time when many staff were working from home and surveys showed that people were feeling rather isolated and disconnected.
Click here to view the accessible version of this interactive content
Team Profiles
One of five ThingLink infographics showing the teams within the Centre for Higher Education (CHEP). Responsible for academic professional development across the University of Southampton for Education; Research and Knowledge Exchange and Enterprise staff plus Doctoral students.
The department delivers some mandatory training for lecturers and PhD students who frequently act as demonstrators. I livestreamed and recorded events including an annual internal conference and created multiple SharePoint sites populated with the videos and ThingLink infographics.
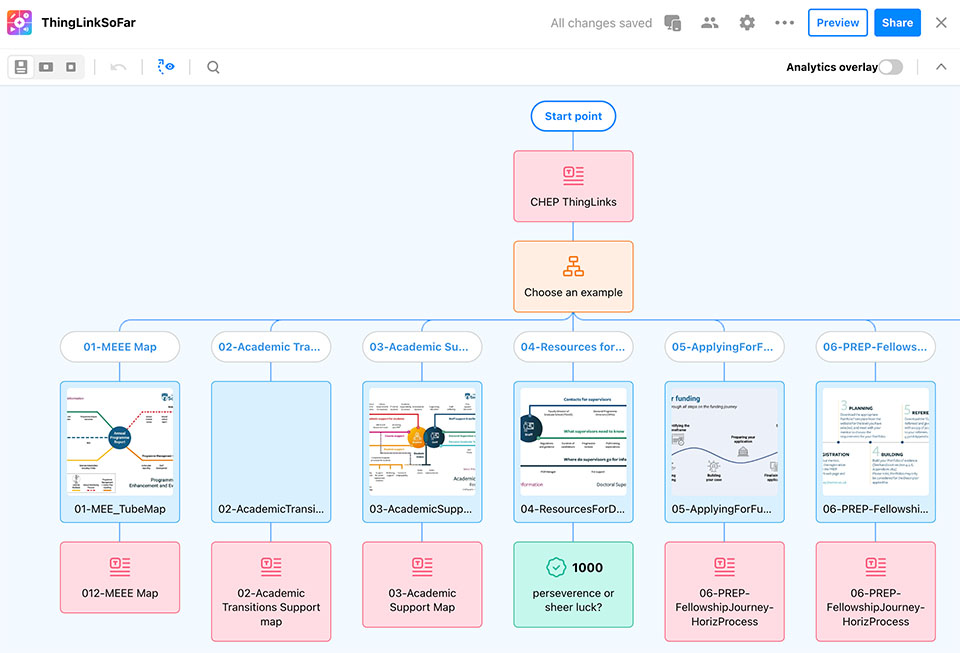
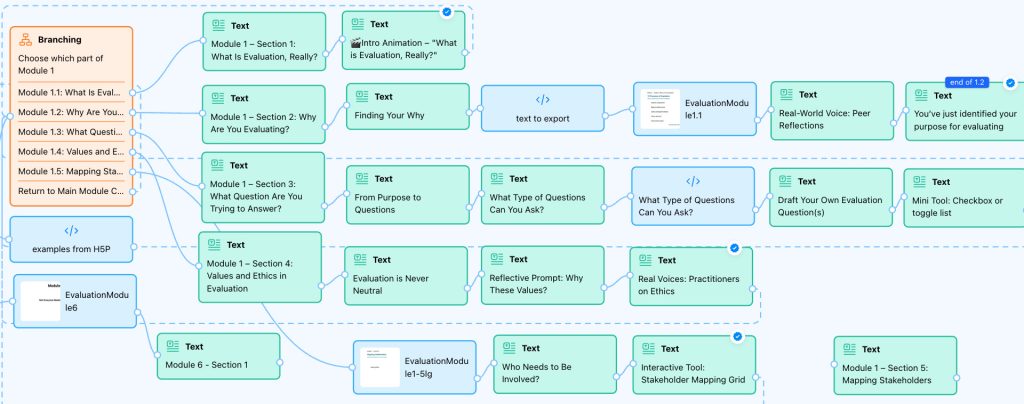
Branching Scenarios
After first exploring scenarios by co-creating some Dungeons & Dragons adventures with my kids, I next used scenarios for a University presentation to showcase our adoption of ThingLink.
The ‘How to Evaluate‘ prototype (only Module 1 has example content) was created in response to an ambitious brief that called for some functions not yet supported within ThingLink. Some embedded H5P was on a hosting site that is no longer live.
Click here to view the accessible version of this interactive content